Objectives

  • Apply knowledge to interpret data researched on mass incarceration
  • Create an infographic on mass incarceration

Vocabulary

  • Mass incarceration
  • Infographic

Materials

  • Computer

Mass Incarceration Infographic Project

Step 1: Introduce the concept of an infographic. Share that an infographic is a visual representation of data that uses a combination of images, graphs, and design to explain an idea. Infographics can be a helpful an interesting way to communicate a lot of information quickly.

Step 2: Show students the following infographic.
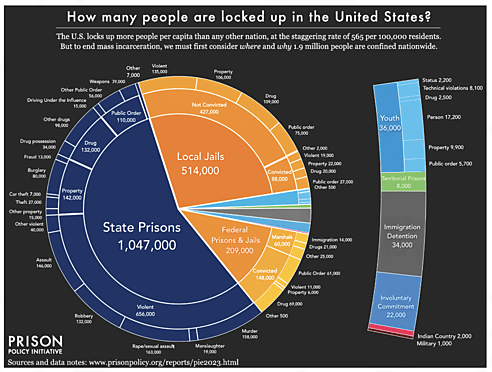
Mass Incarceration Infographic

Step 3: Ask students to share something surprising, something interesting, and something troubling about what they notice. Discuss the graphic with students and share that this is an example of an infographic.

Step 4: Explain to students they will be creating their own infographic. Share that in addition to teaching them how to create visualizations of information, this assignment is designed to familiarize them with the magnitude of the impact of mass incarceration. Discuss the assignment details below with students and requirements for their graphic.

Project Requirements

Every infographic must cover all the following topics:

  • Definition of “mass incarceration”
  • Examples of mass incarceration
  • People affected (demographics—not limited to race and ethnicity)
  • Where the issue is most prevalent (countries, regions, states, communities)
  • Top contributors
  • Associated costs

The imagery for all six topics will be displayed on a single slide, giving it the appearance of a digital poster. Each section has unique requirements as to what specific information and images are required.

  • Definition
    • Find three definitions of mass incarceration from reliable sources and pick the one that is most complete. You will only cite your final chosen definition source.
    • The definition must be labeled “Definition” and be in a semi‐​transparent box.
  • Examples
    • Under the heading “Examples,” list three specific examples of problems caused by mass incarceration.
    • Each example must be labeled along with a corresponding image.
  • People Affected
    • Label the approximate number of people directly and indirectly affected each year by mass incarceration.
    • Display the number in a large, bold font, and overlay the number with an image.
  • Where Is the Issue Most Prevalent? (Countries, Regions, States, Communities, Etc.)
    • Under the heading “Where Is the Issue Most Prevalent?,” create a world map and then find, label, and color one country per region most affected by mass incarceration in the following regions:
      • North America
      • Central America/​Caribbean
      • South America
      • East Asia
      • South Asia
      • Middle East
      • Africa
      • Europe
    Use the template at this URL to create your map: mapchart​.net/​w​o​r​l​d​.html. Ensure that all highlighted countries are labeled either in the key or on the map itself.
  • Top Contributors to the Problem
    • List a minimum of three causes that contribute to mass incarceration.
    • For each contributing factor, include a corresponding image that directly relates to the cause.
    • Group all identified contributing factors under a header titled “Top Contributors to Mass Incarceration.”
  • Associated Costs
    • What are the associated costs of your issue? Consider the following:
      • Financial
      • Environmental
      • Human
      • Any other relevant costs
    • Choose two or three from the list above and provide a statistic and a visual to accompany your examples.